
State education officials have released the 2018 California School Dashboard, an online tool designed to help parents, educators and the community see how schools and districts are educating and supporting students.
The latest version of the state’s accountability system continues the practice of bundling together visual indicators showing performance and progress using the most current data available, including test scores and graduation rates.
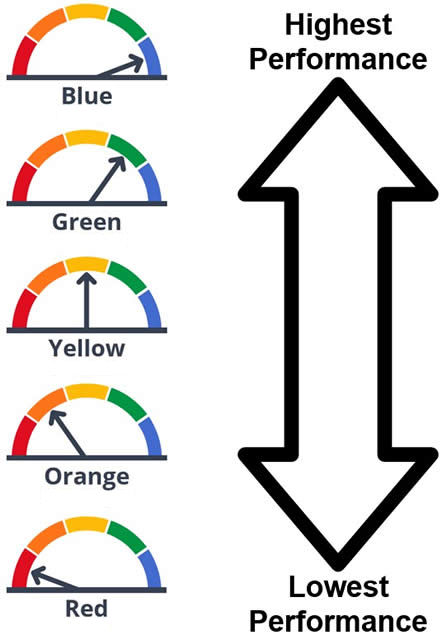
But the 2018 edition no longer relies on color-coded pie pieces to show how schools are doing. Instead, the pies have been replaced by a cluster of performance gauges, each with five color bands. An arrow pointing toward blue represents the best outcome; an arrow in the red is the lowest score.
“The Dashboard helps schools identify strengths and weaknesses in many different areas that measure success,” State Superintendent Tom Torlakson said. “I urge educators, parents, and communities to turn this data into positive action by using it to target resources where improvement is needed and to share practices where success is demonstrated.”
First unveiled in the spring of 2017, the California School Dashboard is considered a key piece of the state’s recently overhauled accountability program for public schools. The gauges use statewide data to present a picture of how each school or district is performing overall, as well as how much they’ve improved or declined over time. Results are broken down by subgroup — including low-income students, English learners and foster youth — to help identify and close achievement gaps.
This year, two new metrics have been added to the mix. Schools, districts and county offices of education that serve K-8 students are being evaluated for the first time on school attendance through a chronic absenteeism indicator. In addition, high schools are being assessed based on criteria established for the college/career readiness indicator.
Other indicators measure performance and progress in academics — based on English language arts and math test scores —suspension rates, English learner progress and graduation rates.
State officials have sought to make the Dashboard as user-friendly as possible, but its usefulness goes beyond its role as a public-facing accountability tool. At the local level, it identifies strengths and areas for improvement, assisting educators and communities with the process of aligning resources to support students who are struggling. At the state level, it determines which districts are eligible for customized assistance through the State System of Support process, which involves county offices of education and other agencies.
Last year, 228 districts were eligible for state assistance, which is triggered when a district has one or more student subgroup in the “red” on two metrics. This year, with the dashboard’s added metrics and other changes, 374 districts are expected to qualify for specialized assistance.
To see results for individual schools, districts and county education offices, go to www.caschooldashboard.org.