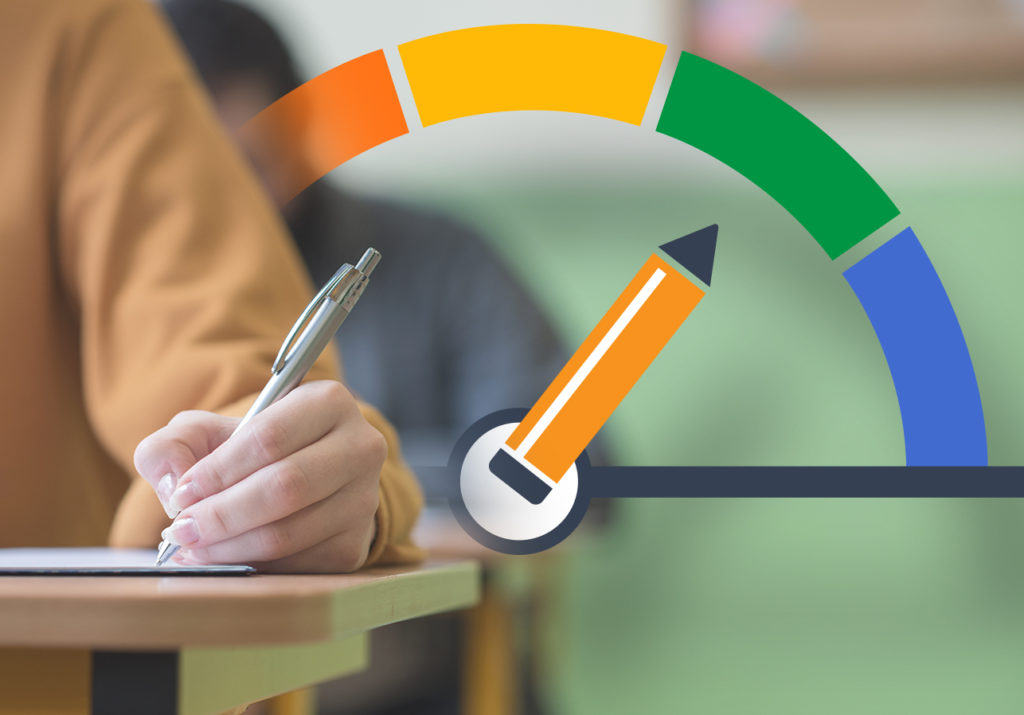
State education officials have released the 2019 California School Dashboard, an online tool designed to help parents, educators and the community see how schools and districts are educating and supporting students.
The Dashboard includes the latest data available on 2018-19 graduation rates, suspension rates, test scores, English learner progress, college and career readiness, and chronic absenteeism.
“The California School Dashboard is a data-driven approach to provide the ‘whole picture’ of a school for educators and parents,” State Superintendent Tony Thurmond said. “The Dashboard empowers local communities to identify opportunities and resources to better serve their students, and provides parents and educators with meaningful information on school and district progress so they can participate in plans to improve student learning.”

Statewide, the Dashboard shows that California public schools are making progress on four out of six statewide indicators: The statewide graduation rate increased 2.2 percentage points, from 83.7 percent to 85.9 percent. The suspension rate fell slightly from 3.5 percent to 3.4 percent. The college/career readiness rate grew 1.8 percent — 44.1 percent of students are now deemed ready for college when they graduate from high school. Both math and English test scores are also up: a 2.9 point increase in math and a 3.1 point increase in English.
First unveiled in the spring of 2017, the California School Dashboard is considered a key piece of the state’s overhauled accountability program for public schools. The gauges use statewide data to present a picture of how each school or district is performing overall, as well as how much they’ve improved or declined over time. Results are broken down by subgroup — including low-income students, English learners and foster youth — to help identify and close achievement gaps.
State officials have sought to make the Dashboard as user-friendly as possible, and its usefulness goes beyond its role as a public-facing accountability tool.
At the local level, it identifies strengths and areas for improvement, assisting educators and communities with the process of aligning resources to support students who are struggling. At the state level, it determines which districts are eligible for customized assistance from county offices of education and other agencies.
This year, 333 districts are eligible for state assistance, which is triggered when a district has one or more student subgroup in the “red” on two metrics. Last year, 386 districts qualified for state assistance.
To see results for individual schools, districts and charters, visit the Dashboard’s site here.
