The 2024 California School Dashboard is up and running, offering both big-picture and detailed views of how public schools and districts are supporting students across the state.
Originally launched in 2017 by the California Department of Education, the dashboard is an online platform that’s updated annually with information about district and school performance. Like the dashboard of a car, it features gauges — in this case, color-coded ones — and other visual icons to make complex data more accessible to families, educators and community members.
To see how your school or district performed, visit www.caschooldashboard.org and enter the name in the search field. Watch the video above for a step-by-step walkthrough.
“Data is a powerful tool for driving improvement, and the California School Dashboard is one way to empower educators, families and communities with a clear understanding of student progress and school performance,” said Orange County Superintendent Dr. Stefan Bean. “By highlighting strengths and identifying areas for growth, the dashboard not only guides informed decisions at the local level but also enables OCDE to provide more targeted support to districts as they work to meet the needs of every student.”
State education officials say the latest data release shows significant progress in key areas. For example, chronic absenteeism has declined by 16.7 percent year-over-year in California, with more students consistently attending school.
Graduation rates continue to climb, marking the largest cohort of students graduating from K-12 schools since 2017. Additionally, more graduates than ever are earning distinctions such as the State Seal of Biliteracy.
What’s on the dashboard?
Along with English and math assessment results, the dashboard packages a number of state indicators like graduation rates, suspension rates, English learner progress and chronic absenteeism stats, as well as measures to show college and career readiness. It also features self-reported local indicators that reflect family engagement, school climate and the condition of facilities.

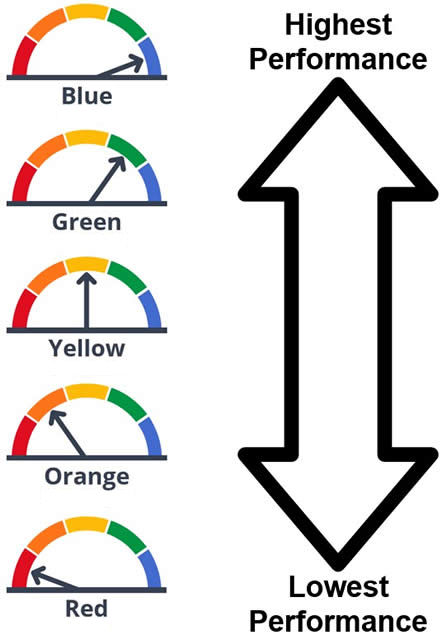
All of the state measures use the same familiar five-color gauges, with arrows pointing to performance levels that range from blue (highest) to red (lowest). These graphics were designed to provide clear, visual snapshots of school performance and progress over time. But there are also links to take deeper data dives — for example, to see how specific student groups are doing.
The 2024 dashboard introduces two notable updates. Science has been added as a state indicator for the first time, using unique calculations that make these results not directly comparable to English or math. Additionally, long-term English learners — defined as students who have not attained English language proficiency within seven years of being classified as English learners — are now included as a distinct student group, providing greater insight into their performance and progress.
Accountability and beyond
While it’s billed as a valuable tool for transparency and accountability, the dashboard has become an important resource for local decision-making. School and district leaders use its insights to evaluate programs, identify areas for growth and plan investments to support student success.
For districts that fall short of their performance goals, the state asks county offices of education like OCDE to provide extra support in the form of Differentiated Assistance. This is a structured process that focuses on collaboration, problem-solving and building local capacity to meet students’ needs.
Eligibility for Differentiated Assistance is triggered when one or more student groups in a district falls within the “very low” status — represented by the red performance band — in two or more priority areas.
Eligibility for assistance
In Orange County, Differentiated Assistance typically is initiated to addresses challenges among foster youth, students experiencing homelessness and long-term English learners in areas such as academics, chronic absenteeism, suspensions, and college and career readiness.
This year, 15 local school districts have been identified by the state as eligible for Differentiated Assistance. Of these, nine districts were eligible the previous year, while six are newly identified. Meanwhile, six OC districts have successfully graduated to “Year 2 progress monitoring,” meaning they demonstrated sufficient improvement after entering Differentiated Assistance the previous year.
In California, 436 school districts and county offices of education are eligible for differentiated assistance this year, marking continued improvement from the record 617 districts and county offices identified in 2022. The student groups with the greatest needs are long-term English learners, students with disabilities and youth experiencing homelessness, according to state officials.
Additional dashboard resources
- Getting to Know the California School Dashboard (PDF)
- Getting to Know the Dashboard State Measures (PDF)
- How Dashboard Colors are Determined (PDF)
- How to View Performance of a School or District on the Dashboard (PDF)
- Exploring the Equity Report (PDF)
- How to Compare Schools on the Dashboard (PDF)
- Getting to Know the Local Measures (PDF)
- Information on Local Measures for Parents (PDF)
Translated flyers are also available in multiple languages.
Want to see how your school or district performed? Visit the California School Dashboard at www.caschooldashboard.org.
