

State education officials have unveiled the 2023 edition of the California School Dashboard.
First introduced by the California Department of Education in 2017, this online platform provides a comprehensive look at how public schools and districts are educating and supporting students, using color-coded gauges and other visual icons designed to make information accessible to families, educators and the community.
Like in previous years, the dashboard displays data on assessment results, graduation rates, suspension rates, English Learner progress, chronic absenteeism, and college and career readiness. It also includes several local indicators, such as basic conditions, family engagement and school climate.
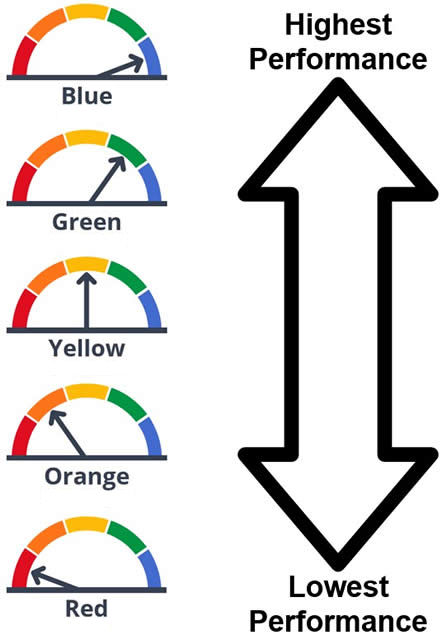
This year saw the return of gauges with five color bands ranging from blue (highest) to red (lowest) for all state measures except college and career readiness. These familiar graphics are designed to visually represent not only performance but also year-over-year progress.
Guiding educational decisions
Beyond being a public accountability tool, the dashboard plays a vital role in guiding local educational decisions and investments. For example, results may provide valuable information to district leaders about the effectiveness of expanded learning opportunities, interventions and other initiatives that support student success.
For districts that fall short of their specific dashboard performance goals, the state has established a process where county offices of education like OCDE offer targeted support. This process, known as differentiated assistance, complements districts’ own efforts to ensure student needs are being met.
“Orange County district leaders utilize their district and school level dashboard results in conjunction with local data to provide a holistic picture of strengths, as well as areas of opportunity to support student academic and personal growth and achievement,” said OCDE Continuous Improvement Administrator Diane Ehrle.
2023 state dashboard highlights
While results vary from district to district, the 2023 dashboard reveals that California students are graduating at higher rates when compared to the pre-pandemic era, and chronic absenteeism has declined.
The four-year graduation rate for the class of 2023 is 86.2 percent, which is slightly lower than the class of 2022. That subtle dip is attributed to the phasing out of temporary flexibility in graduation requirements and course grading policies during the pandemic.
Meanwhile, the chronic absenteeism rate fell to 24.3 percent in 2022-23, down from last year’s high of 30 percent. Notably, equity gaps in chronic absenteeism are shrinking, with vulnerable students making the fastest improvements. More California graduates are also meeting UC and CSU admission requirements, with 50.4 percent of students eligible for admission to California’s public universities.
“This is encouraging news, and our work is not complete,” State Superintendent Tony Thurmond said in a news release on Friday. “We have made an unprecedented investment in services that address the needs of the whole child. We can see that those efforts are paying off, but this is only the beginning.”
Identifying needs, effective strategies
After a three-year break amid pandemic-related disruptions, the California School Dashboard returned exactly one year ago today. That release followed the resumption of statewide assessments in the spring of 2022, allowing for a more complete picture of how well California’s students were meeting grade-level standards in English and math.
The 2023 dashboard, with its cluster of gauges and links to dig deeper, provides a second data point since the COVID-19 pandemic. It will also help identify specific performance gaps among student groups through its equity reports, which are available for each state measure.
These reports shine a light on both the successes and challenges that county offices, districts and schools are experiencing in addressing disparities. They also highlight schools that have found effective practices to narrow gaps between student groups.
“We need to continue providing students with the tools they need to excel, especially now that we are successfully re-engaging our students and families, so we can close gaps in achievement in the same way that we have begun to close the equity gaps in attendance and absenteeism,” Thurmond said.
To access the dashboards of individual schools and districts, visit www.caschooldashboard.org.
Additional resources from the CDE
- Getting to Know the California School Dashboard (PDF)
- Getting to Know the Dashboard State Measures (PDF)
- How Colors are Determined (PDF)
- How to View Performance of a School or District on the Dashboard (PDF)
- Exploring the Equity Report (PDF)
- How to Compare Schools on the Dashboard (PDF)
- Getting to Know the Local Measures (PDF)
- Information on Local Measures for Parents (PDF)
Translated flyers are also available in multiple languages.