
Quick look: The state has released the 2025 California School Dashboard and new data showing steady gains in graduation rates and attendance. The dashboard uses color-coded visuals to help families and educators track progress and identify areas for improvement at the school and district levels.
The California Department of Education on Thursday released the latest California School Dashboard, along with a new batch of statewide data that points to continued progress in graduation rates, academic achievement and attendance.
The online Dashboard serves as California’s public-facing tool for tracking how schools and districts are supporting students. Along with English and math assessment results, it packages a number of state indicators — including graduation rates, suspension rates, English learner progress and chronic absenteeism — as well as measures of college and career readiness.
It also features self-reported local indicators that reflect family engagement, school climate and the condition of facilities.
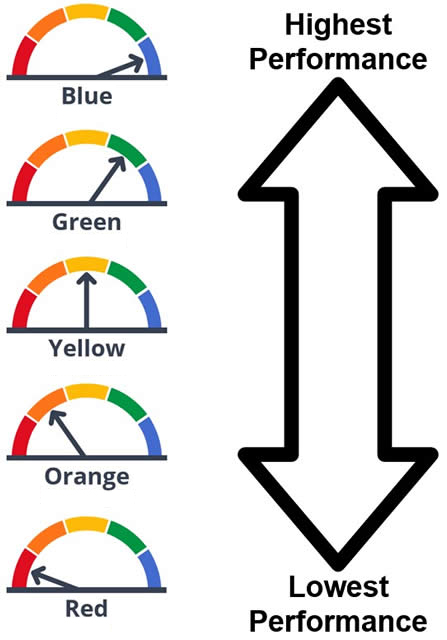
All of these measures are displayed through the Dashboard’s now-familiar color-coded gauges, which range from blue (highest performance) to red (lowest). Designed for transparency and accessibility, the gauges offer quick snapshots of progress alongside links that allow users to take deeper dives into data for individual schools and student groups.
To see how your school or district performed, visit www.caschooldashboard.org.
While it’s billed as an accountability tool, the Dashboard has become an important resource for local decision-making. School and district leaders use its insights to evaluate programs, identify areas for growth and guide investments that support student success.
Dr. Stefan Bean, Orange County’s superintendent of schools, said the Dashboard continues to be an important tool for understanding student needs and tracking progress.
“The Dashboard informs our work because it represents something bigger than numbers — each data point reflects students, teachers and stories of growth,” Dr. Bean said. “We’re encouraged by the progress reflected in this year’s data, and we also recognize there’s more work ahead. Our 5-3-1 Strategic Plan gives us a strong foundation to build on what’s working and continue improving outcomes for every learner in Orange County.”
Data shows gains statewide
This year’s data release, through updated reports on the state’s DataQuest site, showed steady improvements in several key areas.
California’s four-year graduation rate rose to 87.5 percent — the highest since the Dashboard’s debut. Meanwhile, Orange County once again surpassed the state average, with a rate of just about 93 percent.
Chronic absenteeism also continued to trend downward for a third consecutive year. Statewide, about 19 percent of students in transitional kindergarten through grade eight were considered chronically absent in 2024–25, meaning they were absent for 10 percent or more of the instructional days they were enrolled to attend. In Orange County, the rate was significantly lower at about 14 percent, based on 62,789 chronically absent students out of an eligible enrollment of nearly 439,000.
The state also reported modest growth in academic achievement and an increase in the percentage of students identified as prepared for college and career. For the first time, the college and career indicator now credits students for completing Advanced Placement courses — not just exam results — expanding how readiness is recognized.
A new science indicator, based on performance on the California Science Test, was introduced this year for informational purposes, adding another dimension to the state’s accountability system.
County support for districts
When districts or schools fall short of state performance targets on the Dashboard, county offices of education like OCDE are tasked with providing extra help through a process known as “differentiated assistance.” This collaborative approach focuses on identifying challenges, building local capacity and ensuring that all student groups receive the support they need.
Data released Thursday showed fewer districts qualifying for differentiated assistance compared with last year, suggesting progress across multiple measures. Statewide, 418 districts and county offices were identified for support this year, down from 436 in 2024. In Orange County, 10 districts were identified for assistance based on their Dashboard results, down from 15 last year.
State leaders noted that the improvements follow recent state investments in programs such as community schools, expanded learning, universal meals and literacy support. State Superintendent Tony Thurmond said the gains across every indicator show those efforts are making a difference for students.
“Seeing modest improvement on every Dashboard indicator should encourage us to deepen our investments in every child’s progress,” Thurmond said. “Strategies like community schools and literacy coaches are making a positive impact for the whole child, and we must not rest until all students’ outcomes represent their brilliance and potential.”
The 2025 California School Dashboard can be accessed at www.caschooldashboard.org, and detailed data reports are available on DataQuest.