
After a three-year hiatus, the California School Dashboard has returned.
Considered the centerpiece of the state’s school accountability efforts, the dashboard is an online resource designed to show how well schools and districts are performing using easy-to-read visual indicators. On Thursday, the California Department of Education rolled out the latest version based on data from the 2021-22 school year.
“The California School Dashboard provides families and educators meaningful information on school and district progress,” said OCDE Continuous Improvement Administrator Diane Ehrle. “District and school educational leaders can use the release of the dashboard results to refine and strengthen ongoing monitoring of student progress and identifying areas in need of support.”
The last release of the California School Dashboard came in December 2019, a few months before the start of the pandemic and the temporary suspension of statewide testing. Assessments fully returned in the spring of 2022, re-establishing a basis for measuring how well California’s students are meeting grade-level standards in English and math.
But the dashboard reflects more than just test scores. In fact, there are more than a half-dozen state measures used to chart the performance of districts, schools and specific student groups. This data also serves as the basis for county offices of education to provide specialized support — but more on that in a moment.
Along showing performance in English and math, the dashboard’s indicators track chronic absenteeism, which was impacted heavily by COVID-19, as well as English learner progress, high school graduation rates, and suspension rates. Another measure, college and career readiness, won’t be reported on the 2022 dashboard but is expected to return in 2023.
Districts, county offices of education and charter schools also receive ratings based on self-collected data covering handful of local measures. These include basic conditions, implementation of academic standards, school climate surveys, family involvement and engagement, and access to courses.
The same, but different
While the overall purpose of the dashboard remains the same, there are a few differences to note for 2022.
For starters, older versions of the dashboard calculated English and math scores based on a formula that combined the last academic year’s performance with progress over time. But because pandemic-era disruptions led to a two-year gap in universal testing, the 2022 dashboard will only reflect last spring’s performance, or “status.”
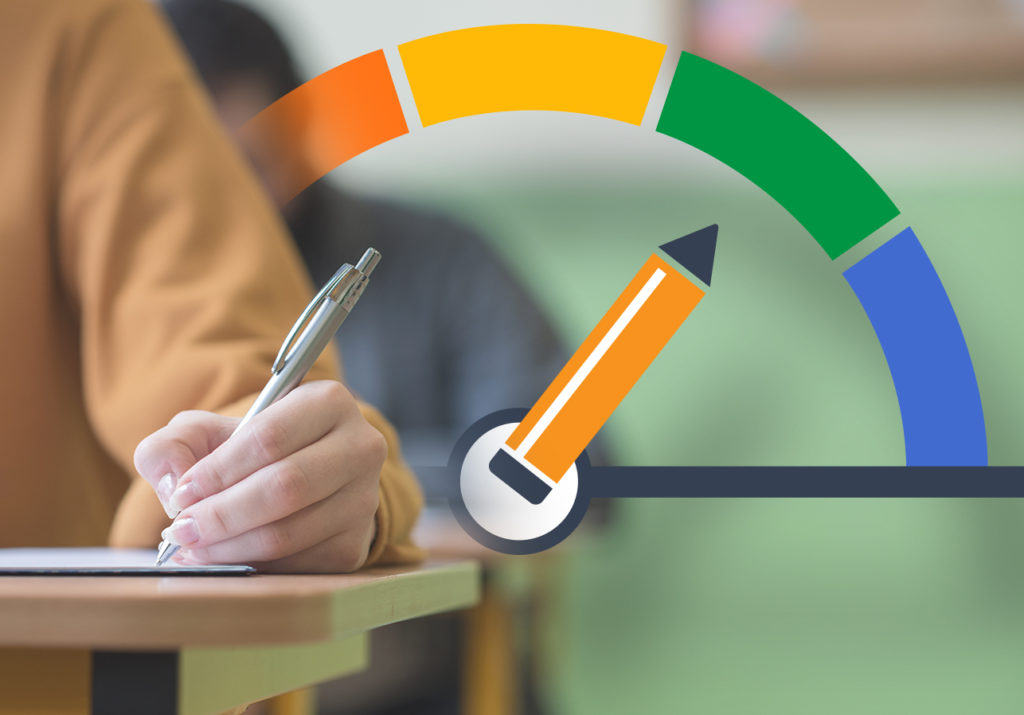
And then there are the actual graphics. You may recall that in the past, the state used color-coded pie pieces or little gauges to show how well a school or student group was doing. The visual indicators for 2022 look more like purple cell phone reception bars, as shown below.
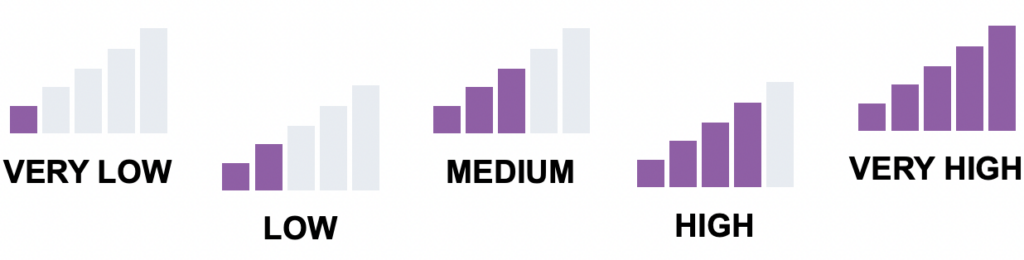
Five escalating bars represents the most favorable rating of “very high,” followed by four bars for “high,” three bars for “medium,” two bars for “low,” and one tiny bar for “very low.” (Note that these are reversed for the chronic absenteeism and suspension rate indicators, where lower rates are desired.)
Once you click on an indicator, you’ll find there’s also an equity report that shows the number of student groups performing at each achievement level. If you click on “View more details,” you can find more information on how those specific groups performed.
How the dashboard is used
As a public accountability tool, the dashboard provides an array of data and information, covering everything from test scores and graduation rates to parent engagement and school climate. But it also drives educational decisions and the allocation of resources.
For districts that don’t meet certain dashboard performance goals, the state has established a process by which county offices of education like OCDE provide targeted support. It’s called differentiated assistance, and it supplements districts’ own efforts to ensure all student needs are being met.
What triggers differentiated assistance? School districts qualify when a student group meets two of these three criteria:
- The student group has a status of “very low” on the dashboard’s English and math indicators — or a status of “very low” on the English Learner Progress indicator.
- The student group has a status of “very low” on the dashboard’s graduation rate indicator — or “very high” on the chronic absenteeism indicator.
- The student group has a status of “very high” on the dashboard’s suspension rate indicator.
Ehrle, OCDE’s Continuous Improvement administrator, said fallout from the pandemic was expected in the 2022 dashboard results, which reveal elevated rates of chronic absenteeism across most student groups. Many of those absences were the result of illnesses or state quarantine guidelines designed to slow the spread of COVID-19 infections on school campuses. Nevertheless, state education officials said they will work with districts to help counter chronic absenteeism, and this week the CDE issued new guidance and announced plans to launch an attendance webinar series in January.
Leveraging data, collaboration
In the days ahead, members of OCDE’s Educational Services team will reach out to districts that qualify for Differentiated Assistance. But, Ehrle said, coordinated efforts are already underway to address students’ academic, social-emotional and behavioral needs, leveraging the Multi-Tiered System of Support framework.
MTSS encourages staff collaboration and data-driven decision making to establish a universal tier of support for all students, additional assistance for some and targeted interventions for those with the greatest needs. In 2016, the state Department of Education selected OCDE as the lead agency to scale up MTSS statewide, and the framework has since been linked to a number of positive student outcomes.
Meanwhile, school districts throughout the county are pursuing other innovative approaches, including using state dollars to create expanded learning opportunities, transforming campuses into community schools, adding on-campus WellSpace centers, and putting in place additional interventions in reading and math.
“The county office will continue to strongly support ongoing district and school MTSS-aligned strategies to re-engage students and enhance student academic achievement and social-emotional and mental health,” Ehrle said.
To access the dashboards of individual schools and districts, visit www.caschooldashboard.org.
Additional state resources
- Getting to Know the 2022 California School Dashboard (PDF)
- Getting to Know the 2022 Dashboard State Measures (PDF)
- Reporting Current Year Data Only on the 2022 Dashboard (PDF)
- How to View Performance of a School or District on the 2022 Dashboard (PDF)
- Exploring the Equity Report (PDF)
- Getting to Know the Local Measures (PDF)
- Information on Local Measures for Parents (PDF)